.svg)
Replenishment is one of the biggest drivers of service levels, spoilage, and margin in food distribution. When forecasts miss, the result is waste, stockouts, and impact to margin.
In this on-demand webinar, we’ll show how distributors are using BFC Replenishment Optimizer (RO) to improve forecast accuracy and ordering for food-specific challenges like short shelf life, volatile demand, and complex buying patterns. You’ll see how RO works in practice, what results teams are seeing, and what it takes to rollout and sustain a smarter replenishment process.
A practical walkthrough of how daily forecasting and replenishment benefit modern food distributors.
Understand where ERP and spreadsheet-driven forecasting struggles with demand volatility, short shelf life, and buyer workload.
Learn how smarter replenishment decisions help teams reduce stockout and excess inventory.
See how teams simplify day-to-day replenishment decisions to buyers can focus instead of constantly reworking forecasts.
Get clarity on how BFC Replenishment Optimizer drives impact with buyers from forecast accuracy and spoilage reduction to buyer efficiency.
Alright. Thank you everyone for joining us, and welcome to this webinar from BFC Software. We are so so excited to have you here, and I am so excited to, have Paul here with us to present this content. Today, we’re going to be talking about forecasting better and replenishing smarter, how to improve service levels, reduce spoilage, and increase profitability. Paul Van Stedum is here with me, and he is a senior solutions engineer for our buying solutions here at BFC. Paul is an expert on buying in many respects, and I will turn it over to him to share content with you. Looking forward to it.
Very good. Good afternoon, everyone.Jeffrey told you, so he was nice and said I was experienced. So I have a, let’sjust say, a handful of decades, experience in supply chain, most of that in, on software side as well as on your side of the equation, you know, buying director purchasing. Things like that in both grocery wholesale, food service wholesale, and a few other industries, and then multiple decades in, the software side as well from a consulting aspect and things like that.
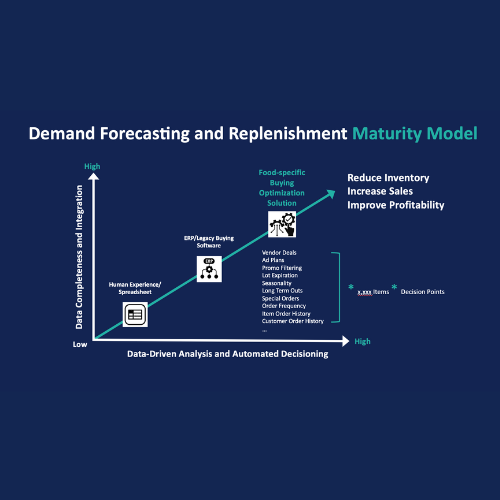
So, we’re going to talk to you today about Replenishment Optimizer. The idea is to give you a flavor of why this solution could bring benefits to your organization. We would love to sit down with you, do an in-depth discovery, and then show you through a demonstration how we can bring those benefits to your company. Hopefully, as we go through this afternoon, you’ll hear things that spark interest and make you think, “Yes, we may have that situation or challenge.” The target outcomes for today are straightforward. First, we want you to understand why daily forecasting matters. We’ll get into that in more detail shortly. Second, we want you to understand the perishable inventory point of view. All of you have perishables at different levels, and we’ll talk about that. Don’t think of perishables as only produce. There are many other perishable items you’re managing, and we can give you a better tool to manage them. Finally, we’ll show how Replenishment Optimizer, one of the many tools BFC offers, can drive revenue and profit while also making your buyers better.I come from the buying side. I’m not an IT person by any stretch of the imagination. I come from the buyer’s world, and the idea of Replenishment Optimizer is to give buyers a better tool so they don’t have to keep everything in their heads and can instead use their time to bring additional value to your organization. Current Practices in Inventory Management
I’m assuming the group we have today is at different places along this line. If we start at the bottom left-hand corner, some of you are probably still using spreadsheets. I bought on spreadsheets, or some kind of automated spreadsheet on a screen that maybe used a 12-week average, an 8-week average, or something similar. I’ve seen many different versions of that. If that’s where you are, you’re definitely a candidate for what Replenishment Optimizer can bring. As you work your way up to the middle, many of you are using some kind of legacy ERP buying solution. ERPs are important and they do a lotof things well, but they are usually strongest at the core ERP functions. When it comes to forecasting, ordering, and replenishment, they can be a little thin. Even if you already have a food-specific buying optimization solution, Replenishment Optimizer brings a whole new level of capability. We’ll touch on those areas throughout the presentation. Below that, you’ll see things like vendor deals, ad plans, promotions, and seasonality. These are all the things your team has to manage, whether they’re using paper, spreadsheets, Excel files, ERP tools, oroptimization systems. How do you deal with vendor deals? How do you plan for customer or store promotions? How do you filter out unusual demand? How do you account for seasonality? When you look at an organization like yours, whether you have 4,000 SKU locations or 20,000 SKU locations, you can multiply that by all those decisions. That’s what your team has to manage. Replenishment Optimizer gives them a better tool to help drive sales and profitability.
A lot of solutions out there forecast weekly. Some call it a period forecast. Most are weekly, while some are four-weekly. The challenge with that is the forecast only gets updated once a week. In many cases, you’re also only alerted to exceptions at the beginning of the following week. When I used to buy, I would see all my exceptions on Monday morning. But those exceptions could have happened on Tuesday of the previous week, and I was blind to them in the meantime. What you really want is a system that is trailing and looking forward, but refreshing daily. You want it updating every day, bringing alerts to you, and giving you a better way to address what’s happening. For example, someone could come in overnight and take a large amount of your inventory. How do you deal with that? Maybe an order was shorted because a truck was late. How do you account for that demand? You also need a system that can automate item expiration. If I’m getting ready to buy bananas and my system says I have 200 cases, that may be all I know. If I’m lucky enough to be near the warehouse, I can walk out and look at them. I might see that some are good and some may be spoiled, but I still don’t really know exactly what I have. You need an automated system that takes that into consideration when making the appropriate buy. We’ll touch on that more. Another key point is that Replenishment Optimizer forecasts based on the amount ordered, not the amount that left your building. If a customer orders 20 but you only fulfill 10, and the system forecasts based only on what shipped, you’ll have a very accurate forecast for the wrong number. You’ll buy 10, sell 10, and think your inventory accuracy is great. But you’re losing sales because the customer really wanted 20. That’s why we want to capture the true order-entry demand when we build the forecast.
This solution is designed specifically for food, whether grocery wholesale or foodservice wholesale. The challenges are similar. The buyer’s goal is to optimize service. I bought for a long time, and I’ve never had the advantage of being an owner. The goal is always service, but if someone says they want 100% service level, I hope they also have a bigger warehouse and a lot more cash. The real goal is balancing fill rates, profitability, inventory levels, buying cadence, and spoilage reduction. Spoilage can be a surprise to some organizations because of how much it can cost in bottom-line profitability. Whether you’re a foodservice or grocery wholesaler, the percentage of annual revenue tied to perishables may vary. But when you start looking closely, perishables are not just produce. You have dairy, yogurt, eggs, milk, fresh meat, fresh seafood, beverages, frozen items, and even some canned and dry goods that have shelf lives. Some shelf lives are longer than yogurt, eggs, or produce, but they still matter. These products represent a large part of your revenue, and you need a better way to manage them. Replenishment Optimizer helps make theright forecasting, replenishment, buying, and inventory decisions for anything with an expiration date tied to it.
What do we need for perishable buying? First, we need to understand age-based replenishment. That means if I have 200 cases of bananas on hand, I need to know the lot and expiration dates for those cases. I also need to know whether some of them will spoil before my next order arrives, because that should be considered when I place the order. We also need to understand substitution rules. If one item is substituted for another, we need to capture demand appropriately. Perishable items often have shorter reorder cycles. Many of you already know this. Some perishable items are being bought two, three, or four times per week. In those cases, we also need to understand the exposure period. Our system can forecast different lead times by order day. For example, let’s say you order yogurt twice a week. If you order on Monday, it arrives Thursday. But if you order on Wednesday, it may not arrive until the following Monday. That means the number of days of demand you need to cover is different depending on the order day. The system helps determine that, and it will make more sense as we get into how spoilage is considered when making the buy. Because of spoilage, 1% to 5% of profitability may be leaking out of the business. That may even be a conservative number.
With this tool, we’ve seen customers recapture 25% to 40% of that spoilage leakage, and sometimes more. Here’s something to think about. One advantage of capturing lot and expiration data is that the system can project spoilage ahead of time and alert you before it happens. We had a customer using the system who had an item that was overstocked. They had bought it for a customer, not for a promotion, and it was going to expire about three months out. The system alerted them that normal sales would never consume the inventory in time, and they were facing a $40,000 to $50,000 hit. Because the system brought it to their attention, they reorganized their promotional schedule and eliminated that spoilage. In one deal, one item practically paid for more than half the system. That’s the real key. We want to give buyers better tools, and we want owners and management to improve cash flow and profitability.
Buying is a challenging job. You’re always balancing service level, carrying costs, out-of-stocks, and too much inventory. So what does Replenishment Optimizer do? It is an end-to-end solution. It captures demand, forecasts,and executes replenishment. There are solutions out there that only do forecasting, while another separate solution handles execution or replenishment. That can create blind spots and limited touchpoints throughout the week. Replenishment Optimizer brings those pieces together. It also includes a profit simulator. Most organizations have some idea of their service-level goals. In the past, we used to call it replenishment level. We might say we always want to carry six weeks of one item and eight weeks of another. It was based on movement and importance, but it was still a broad-brush approach. In this solution, we help you set service-level goals based on your highest-priority items, whether that’s dollar movement, case movement, or another measure. We also consider the profit those items bring to your bottom line. The system is also driven by customer order entry. We want to capture how much the customer actually wanted when they placed the order. The system gives you visibility to that information and can use it to filter out redundant reorders and other demand distortions. The whole system is built for food. Grocery and foodservice are what it is designed for. The system determines when to buy by looking at service-level goals, lead times, upcoming promotions, seasonality, and whether demand is entering or leaving a seasonal pattern. It asks: When do I need to place this order to maintain the service-level goals I want with the least amount of inventory? The next question is how often to buy. That’s different from when to buy. How often to buy looks at things like full-truck requirements and carrying costs. If I have to buy a full truck, what is the carrying cost of buying that full truck compared to ordering smaller amounts more frequently? Many buyers like a seven-day order cycle. But seven days may not be the most cost-effective cycle. When I was buying, I bought a full truck from a vendor every week and saved the company 5%. I went home proud of myself. But if you analyze it and find that it takes 12 days to consume that truck, then every second or third order may be carrying extra inventory you don’t really need. Then there’s the question of how much to buy. The system considers seasonality, upcoming promotions, EOQ,and forward buying. If I’m buying an inexpensive item every few days and there is no shelf-life concern, I’m not going to buy six every other day. I may buy 24 or whatever quantity makes sense.
We’re going to spend some time on this slide because it is the heart and foundation of Replenishment Optimizer. First is true daily demand forecasting. Some companies update forecasts weekly and then back into a day-of-week profile. For example, if I’m buying eggs twice a week and I know we sell 60% of our eggs on Thursday, maybe I can carry fewer eggs on Monday. But that is still more of an estimate. Replenishment Optimizer updates the forecast every day and can systematically create weekly splits and profiles within the forecast. That allows you to react much more quickly. The next piece is SALSA, which stands for Service and Lost Sales Analysis. If you’ve been a buyer, you know that out-of-stocks happen. A customer may order 10 today and you don’t have it. Tomorrow they order 10 or 15. The next day they order 20, knowing that eventually you’ll get the product back in. Many systems add all that demand together, which creates artificially inflated demand. The customer may have really wanted only 10 or12. SALSA helps filter that out. Because we have the order-entry history in the system, we can see if the same customer ordered 10 today, 10 tomorrow, and 11 the next day. We can filter out much of that repeated demand so the forecast is not artificially inflated. Otherwise, safety stock goes up because deviation goes up, and you end up carrying more inventory than you need. Next is data scrubbing. When anomalies happen, the system highlights exceptions. It helps filter out unusual activity. For example, if we normally sell 100 units per week and suddenly demand jumps to 250, the system looks at who placed those orders and helps filter out anomalies. The goal is to clean the data so the exceptions that reach your team are fewer, but more important. Then we have customer demand visibility. I would have loved to have this in my buying days. Right inside the same system the buyers are using, they can see every customer’s order entry. Let’s say I went to bed with plenty of inventory and woke up out of stock. My first question is: Who did it? In the old days, I would swivel from one computer to another to look up who bought the product. Maybe that system was a day behind, so Imight not even have visibility yet. In Replenishment Optimizer, I can hit a button and see who bought the product overnight. If one customer bought 40, I can hit another button and see whether that customer has bought 40 before. The system helps determine whether that demand is reasonable or whether it was a cherry-picker customer who only came to us because their primary vendor was out. Then there are promotional filters. Anytime there is an event or promotion, whether for certain customers or all customers, the system can separate promotional lift fromnormal demand. For example, if we normally sell 100 per week and sell 300 per week during a two-week promotion, the system filters the lift above the normal seasonally adjusted forecast into a promotional bucket. Then thefore cast can return to reality after the promotion ends, without a hangover effect. Finally, we have lot spoilage analysis. Replenishment Optimizer takes a feed from Dakota WMS, or another WMS if applicable, showing what is on hand, the lot expiration, and how inventory is broken down. The system uses that data to make the right replenishment decision.
Here are a couple of our customers. Some are grocery, some are foodservice, and some have both. This shows how we are truly built for food. We understand this industry. Because of that, we can help reduce safety stock, reduce inventory, and increase fill rates. Here is the daily buyer’s workbench. Every day when your team signs on, the system has already taken in the latest information. It knows what sold, what was received, what was short-received, what was out of stock, and everything else. It builds a daily workbench for the buyers. Under alerts, remember that we are forecasting daily. If a spike or dip happened last night, you are alerted to it today. With another system, you might not see that alert until the following Monday. You may be thinking that daily forecasting would generatemany more exceptions. But because of the filters and tools we discussed, that is not the case. For a user to go through alerts, including unusual demand, lead time updates, and receipt issues, it may take only 30 to 45 minutes. Then they can focus on orders that need to be placed. Those orders have already been built based on the rules,such as pounds, pallets, truckload requirements, or other constraints. Thebuyer can review them in a very exception-based way. This workbench can also be customized by role. If I’m a manager, I can have a wide-open view and see the whole team’s challenges for the day. If I’m Paul and I’m responsible for certain vendors, then when I sign on, the screen is customized to me. Even the report graphs on the side are specific to me, such as Paul’s service attainment or Paul’s inventory stratification. One alert I like is under order alerts. Receipt issues are more reactive, such as being shorted or having an overdue order. But order alerts are proactive. The system may show that an order is not late yet, but you are going to run out of inventory before it arrives. That gives you time to expedite or take action. All of this is presented in a way that helps users quickly drill in, handle exceptions, and move on.
Daily forecasting updates every SKU. The system cleanses data using pattern recognition. It asks questions like: Has this customer ordered this before? Should this demand be kept in the forecast? It also understands and adjusts for seasonal tendencies. Some SKUs are easy to understand seasonally. I’m from Chicago. When it’s hot, we sell more Gatorade. When it’s 22 below, maybe not as much. But the system also helps account for more complicated seasonality, such as moving holidays. Easter is a challenge in the food industry because it moves by several days or weeks each year. The system helps account for that. Daily forecasting helps you react and stay on top of demand changes. On the left side of the slide, you can see a traditional approach. Whether the forecast updates weekly or monthly, it takes longer for the forecast to catch up when demand changes. On the right side, because the system updates daily, it may take only five to seven days to move from one demand level to another. And that’s if we just let the system do it. Keep in mind that by day two or three, you may already receive an exception alert. That gives you the opportunity to help the system by adjusting the forecast manually if needed. The same thing happens when demand drops. We all like when items grow, but if something is dying, we need to react quickly and avoid carrying inventory no one wants.
Going back to data cleansing, let’s use the example of getting hit with unexpected demand overnight. The first challenge is figuring out who did it. Right on the screen, you can quickly see who bought the product last night. You can view it by customer location, buying group, chain, chain region, or however your customer data is structured. On the screen, you can see order entry demand. We had demand for 87 and shipped 87 because we happened to have it. But when you look at the history, that was a huge jump in demand. The system filtered out 60 units and allowed 27 units to be captured for forecasting. From there, you can drill into who caused the demand. Maybe Chain A did it. Then you can see whether Chain A has bought that amount before. Maybe three months ago they were buying 10, but in the last couple of weeks they’ve been ordering 30, 40, or 50 once a week. That may indicate legitimate demand. That visibility helps you decide whether to call the salesperson or customer and adjust your demand plan accordingly.
We’ve already touched on order entry data, but it is important. Order entry data can overstate lost sales if a customer keeps ordering the same item again and again because they are out of stock. But SALSA helps handle that. If I only forecast service level based on what left the building, I get a false view of service. It’s not the true service level. We had a real customer who thought their service level was around 98% or 99%. As we gathered their data during implementation, we saw that when we captured order entry amounts, their true service level was closer to 96% or 97%. After implementation, the system started doing a better job forecasting and improving service level. They were able to increase sales by 4% without hiring another salesperson and without additional marketing. There was a dip in the data because one truckload of yogurt was a day and a half late. Sometimes things happen. But the system reacted, and they caught up again.
With lot spoilage analysis, we understand what is received and the lot and expiration data tied to it. Going back to the 200 cases of bananas, we need to know the lot and expiration dates. There are two important dates in the system. One is the manufacturer’s expiration date. The other is the number of sellable days you want toguarantee your customers. The system takes both into consideration. For example, a product may have an expiration date of April 24. If today is April 24, none of that product is sellable. The system can also identify product that may be below your customer guarantee but still within manufacturer shelf life. That product maybe discountable. Maybe you have a customer who can take short-dated product at a better price. At least then you recover something instead of losing everything. The system does not just look at what is physically on hand. It looks at what will be sellable when the order arrives. If I have 200 cases of bananas on hand, but 50 will expire before the order I place today comes in, then the system should calculate my order based on 150 usable cases, not 200. This visibility is important and accurate. If you sell fresher product out of order and that is captured, the system knows that some cases expected to expire soon have already been sold. It can react to that. We receive daily feeds from the WMS to protect that accuracy.
Replenishment Optimizer is built for perishables. It shows daily history and day-of-week profiling. It understands that items do not always sell the same amount every day. It can handle produce challenges, random weight, and multiple suppliers. You may buy bananas from three different suppliers in one day, and the system can handle that. It also supports promotional spread. When there is a promotion, the system helps determine how early you should start carrying inventory. With produce and shelf-life items, you have to be careful not to buy too much upfront. The system helps spread the buy appropriately. It can also support midday updates if your host system can provide them. That gives your team a half-day head start to react. Another important capability is different lead times by day of the week. If I order on Monday, the lead time may be three days. If I order on Wednesday, the lead time may be five days. The system understands that and uses it in the ordering logic.
For buyers handling fresh products like meat and produce, forecasting and replenishment has often been more art than science. Some buyers are very good at it, but it is a lot to keep inyour head. We had a customer using our solution where most of the buying team was doing well, but one buyer struggled. He said it was too complicated. You could see how erratic his service levels were. When that person retired, the company hired a new buyer. We trained the new buyer on the system, and that buyer was able to increase service level by almost five percentage points while keeping performance much more stable. The system helped reduce over reaction and allowed the buyer to respond more consistently.
Another part of the system is setting service-level goals. Most customers rank SKUs somehow: A, B, C, D, and so on.Some items might even fall into a category where you ask, “Why are we carrying these at all?” Many systems rank items and say, for example, all A items should be at 99% service level. That may work, but it doesn’t consider profitability. You may have an A-minus item at 97% service level, but the system may show that it is highly profitable. It may recommend adding $150 in safety stock because that investment could bring in an additional $500 in revenue. When I was buying, I thought about profitability, but not at that level when ranking SKUs. This tool can be run in simulation mode. It shows where youare now, what the system recommends, and allows you to agree, adjust, or change the plan. This is something you may want to rerun quarterly or semiannually to understand where you should focus and how your safety stock investment supports service-level goals. This is a big differentiator. I’ve used and sold many systems, and considering profitability in this way is one of a kind.
Forward buying is one of my favorite parts of buying. There are different reasons to forward buy. A vendor may say that during January, certain items are 10% off. The system can automatically calculate how much extra you should buy at the end of that period. In the past, my replenishment reminder was often a sticky note, so I probably missed opportunities. But this is not just about forward buying. It’s about forward buying to the point where you get the highest return before diminishing returns begin. The system understands carrying costs and shelf life. Just because something is a good deal doesn’t mean you should buy 30 days of bananas. The system can handle known deals, known price increases, and sudden opportunities. For example, a sales person might call near the end of the quarter and offer 5% off anything you buy today. With a few keystrokes, the system can analyze the opportunity and tell you what to buy. That eliminates guesswork. When I bought, if I got yelled at about overstock, I bought less. If I got yelled at about out-of-stocks, I bought more. That’s not how you want to run the business.
We talked about lot and expiration data. Yes, we can get this information from other warehouse management systems, but those interfaces may need to be built. The interface from Dakota WMS to Replenishment Optimizer is already built. That allows us to capture lot and expiration data at the time of receiving and update it along the way. If you are using Dakota, that makes the process easier. But regardless, gathering this information into Replenishment Optimizer is crucial.
To recap, Replenishment Optimizer helps eliminate guesswork. Buyers keep a lot in their heads. They often react based ontheir environment. If they get criticized for overstock, they buy less. If theyget criticized for out-of-stocks, they buy more. This system gives buyers better tools. It still relies on their expertise and market knowledge, but it improves efficiency. When they sign on, they don’t have to review every SKU for a vendor. The system has already built the order. They also don’t have to hunt for what ran out last night. That information is already on the alert screen. It helps reduce spoilage by understanding the right inventory to consider when making a buying decision. It also alerts users to product that should be discounted, closed out, or otherwise addressed before it is thrown away. Eighty cents on the dollar is better than zero. It helps optimize inventory levels by considering profitability and handling costs. Buying a full truck may be the right decision, or it may not be. Let the system do that analysis. It improves fill rate through service-level analysis and monitors every SKU every night. If something happened last night, you are alerted today. It also creates alignment because everyone is using the sameset of rules. Different goals can be set, but the analysis is consistent. That helps with training, cross-category coverage, and even opening another distribution center.